The ColdFusion Mobile Platform aims at providing a server and development infrastructure that facilitates rapid and robust mobile application development, debugging, packaging, and deployment. The ColdFusion 11 release introduced rapid application development through ColdFusion Builder. ColdFusion 11 introduces full-fledged on-device debugging to quickly debug your ColdFusion-based mobile applications on devices.


The ColdFusion Builder has introduced a new debug server (agent) that acts as a broker between the IDE and the device. There will be a two-way communication between the debug agent and the IDE.


The IDE provides the debugging information like breakpoints, step over, step in, step out, and resume to the debug agent. In return, the debug agent provides information like where the code has paused to the IDE so that the IDE can show the appropriate source file with the highlighted line. When the device starts executing the code, communicates with the debug agent to get information on when to stop.
There are different scenarios through which you can debug your applications. ColdFusion Builder supports both local and remote debugging.
- You can debug your application running on a browser.
- You can debug a PhoneGap application running on the device.
- You can debug a standalone HTML5-based mobile application running on the device.
- Many developers can connect to a remote ColdFusion Server and debug their projects.


In scenario 3, developers cannot debug the same ColdFusion mobile project simultaneously.
Debugging a packaged application
The new ColdFusion Builder enables you to run ColdFusion-based mobile applications interactively by inspecting the source code during the application execution. If you have already used Eclipse for debugging your applications, you will find debugging in ColdFusion builder easier.
While debugging your application on the browser or on a device, the following debug actions are supported:
- You can set breakpoints (you can set handles in your source code specifying where the execution of your application must stop)
- You can step in, step out, step over, and resume
- You can get variables while debugging
- You can set expressions while debugging
When your application completes loading/execution, you can investigate variables and change their content through a simple interface.
Verify the debug agent configuration
Before you start debugging your mobile application, verify the IP address and port of the Debug Agent. The IP address of the Debug Agent is most likely the IP address of your machine. These IP address and the port value will be automatically configured. To verify or change these values, click Windows > Preferences > ColdFusion > Client Debug Settings.


Setting breakpoints
To set breakpoints in your source code right-click in the small left margin in your source code editor and select Toggle Breakpoint. Alternatively, you can also double-click on this position to enable or disable breakpoints.


Note: that the breakpoints will not be hit for JavaScript code in your application.
Starting the debugger
You need to start the debugger to start debugging ColdFusion mobile applications. Perform the following tasks:
- Before you begin, you need to generate the PhoneGap Debug Build if you are planning to debug your applications on the device. Right click your project and select Generate PhoneGap Debug Build. If you have not configured your PhoneGap settings, you will be prompted to enter the PhoneGap account settings.


- Depending on where you have set the breakpoint, your application may look blank when it starts on your device:


- At this moment, you can see the control at the breakpoint position in ColdFusion Builder. Continue stepping over and debug your application.
This action will start the device debugger. If you have not defined any breakpoints, this action will run your application normally. To debug the application, you need to define breakpoints.
Note: If the code being executed on the browser or the shell application encounters a runtime error, you will see an error message and the debugger will fail to start.
Viewing variables and evaluating expressions
While the debugging session is on, you can view the variables and evaluate expressions easily. Ensure that you have activated the ColdFusion Debugging perspective:
- Click Window > Open Perspective > Other.. and select ColdFusion Debugging:


- Click OK to continue
- You can start viewing the variables through the following window:


- Similarly, you can evaluate expressions:


Stepping in and out
ColdFusion Builder allows you to control the execution of the application you are debugging through simple code stepping actions.


You can step in, step out, and step over to view values of variables and can evaluate expressions.
Debugging a shell application
Setting breakpoints
To set breakpoints in your source code right-click in the small left margin in your source code editor and select Toggle Breakpoint. Alternatively, you can also double-click on this position to enable or disable breakpoints.
Note that the breakpoints will not be hit for JavaScript code in your application.


Starting the debugger
You need to start the debugger to start debugging ColdFusion mobile applications. Perform the following tasks:
- Start the debugger by clicking the Debug Icon on the menu and selecting Debug As > ColdFusion Client Applications


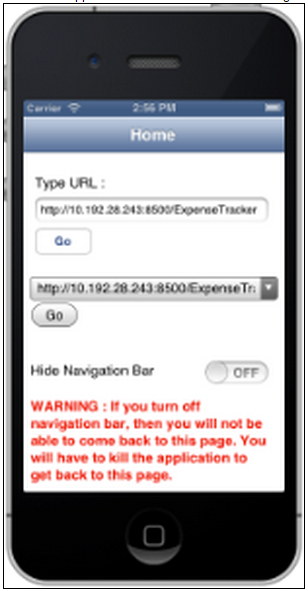
- Invoke the application URL from the device using the ColdFusion Shell application:


- Depending on where you have set the breakpoint, your application may look blank when it starts on your device:


- At this moment, you can see the control at the breakpoint position in ColdFusion Builder. Continue stepping over and debug your application.
This action will start the device debugger. If you have not defined any breakpoints, this action will run your application normally. To debug the application, you need to define breakpoints.
Note: If the code being executed on the browser or the shell application encounters a runtime error, you will see an error message and the debugger will fail to start.
Viewing variables and evaluating expressions
While the debugging session is on, you can view the variables and evaluate expressions easily. Ensure that you have activated the ColdFusion Debugging perspective:
- Click Window > Open Perspective > Other.. and select ColdFusion Debugging:


- Click OK to continue
- You can start viewing the variables through the following window:


- Similarly, you can evaluate expressions:


Stepping in and out
ColdFusion Builder allows you to control the execution of the application you are debugging through simple code stepping actions.


You can step in, step out, and step over to view values of variables and can evaluate expressions.
Troubleshooting tip
Note that on Linux, if the debug agent port is not open by default, you should manually go and enable traffic on that port through your Linux tools/firewalls (iptables). For more information on opening up ports on your machine, read the manual for your Linux distribution.
For more information on using the debugger user interface in ColdFusion Builder, see the Eclipse help.