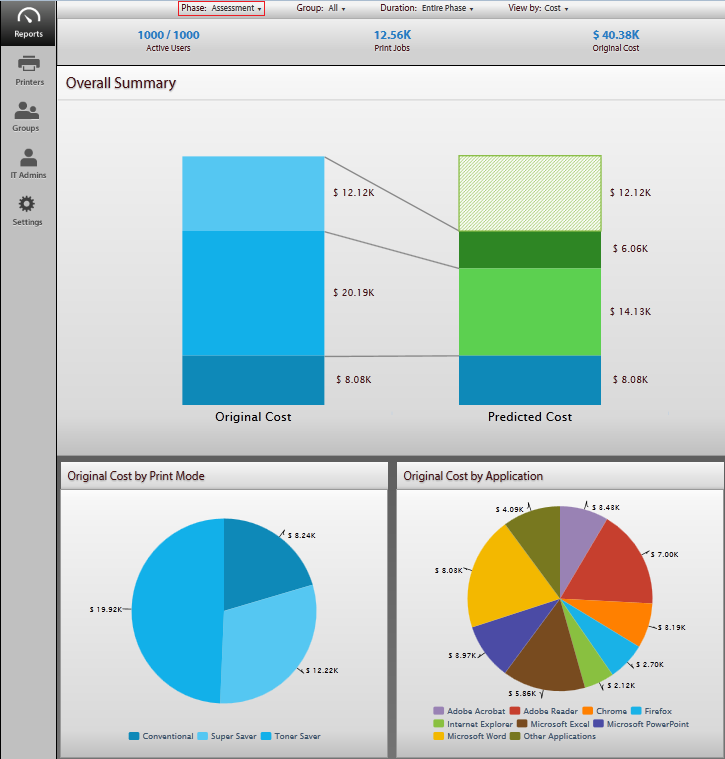
In the assessment phase, LeanPrint helps you tracks users’ conventional print usage so that you can have better understanding of print costs within your organization across various groups.
The reports displayed in the overall summary page show original costs/pages and a predicted value for costs/pages and savings. The predicated values give you a generic sense of how much you could save when you start using LeanPrint in the savings phase.
Note: The predicated savings are displayed based on the following assumption after LeanPrint is installed:
- Overall predicated value: Out of the total cost/pages, 20% will still use Conventional print, 50% will use Toner Saver option and rest 30% will use Super Saver option of LeanPrint
- Within Super Saver, 50% cost savings in cost view and 30% page savings in page view
- Within Toner Saver, 30% cost savings
The other reports - pie charts and tables are displayed only for original cost/pages, and not for predicted costs/pages.

